- About
- Topics
- Picks
- Audio
- Story
- In-Depth
- Opinion
- News
- Donate
-
Signup for our newsletterOur Editors' Best Picks.Send
Read, Debate: Engage.
| August 30, 2022 | |
|---|---|
| topic: | Innovation |
| tags: | #Nigeria, #Africa, #floods, #climate change, #GIS technology |
| located: | Nigeria |
| by: | Ekpali Saint |
Each year, thousands of Nigerians, particularly those living in riverine areas, are affected by flooding. And while there are agencies in place that alert the broad population about upcoming floods through seasonal rainfall predictions, floods still hit certain communities, primarily because no maps exist to indicate the level of specific communities’ susceptibility to flooding.
But a nonprofit organisation is now addressing this crisis by mapping communities and sending its findings to relevant authorities to act upon.
Launched in 2020, Geohazard Risk Mapping Initiative (GRMI) uses a Geographical Information System (GIS) software to provide maps that indicate the level of susceptibility to flood and generate a statistical estimation of areas that might be at risk. Once communities are mapped, the results are shared with relevant agencies, such as the National Emergency Management Agency for swift response.
FairPlanet had a chat with Taiwo Ogunwumi, the founder and president of GRMI, about the processes involved in mapping communities vulnerable to flooding.
This interview has been edited for clarity and concision.
FairPlanet: What inspired you to launch Geohazard Risk Mapping Initiative?
Taiwo Ogunwumi: Many communities in Nigeria are constantly experiencing the effects of climate change through the occurrence of natural hazards (floods). Despite the fact that the governments of the country are making an excellent effort to reduce the risks of various hazards, there is a little gap in the availability and communication of flood hazard early warning information at the community level and a lack of access to the flood disaster reporting application.
Against this backdrop, Geohazard Risk Mapping Initiative was established to [help] fill this gap and save the lives of the populace.
Can you give us some more background information about the initiative and explain how exactly it helps reduce flood risk in Nigerian communities?
Geohazard Risk Mapping Initiative (a non-profit organisation) is the only youth-led initiative in Nigeria that is providing flood maps at the grassroots (community) level.
Our maps indicate the level of susceptibility to flood and provide a statistical estimation of the number of farmlands that might be affected. To us, we feel this is very important to enable farmers to be better-prepared and adapt to the yearly flooding occurrence that is affecting crop production.
Additionally, our maps showcase educational institutions (primary and secondary schools) that are prone to the impact of future floods. Such maps will help the ministry of education in making emergency preparedness provisions for the schools.
Talking about socio-economic activities, if the market is flooded, this will disrupt women’s means of livelihood, most especially those who depend on petty trade to feed themselves and their children. To reduce these risks, our flood maps also indicate major markets that are susceptible to flood and the ranges in the level of susceptibility.
What year did you start mapping communities and when exactly did you launch GRMI?
The organisation was founded in September 2020, but it took us some months to structure it and develop a standard and the internationally recognised flood model framework which [now] guide our analysis.
Since the initiative also relies on youths who are skilled and have a background in Geospatial analysis, Hydrology and Environmental management, it took some additional months to put the team together. But finally, in December 2020, we began our analysis and were able to get all our results ready by April 2021. [The results] were sent to the National Emergency Management Agency, [which is] headquartered in Abuja, in May and June 2021.
At times you identified floods to be a result of climate change. Please elaborate.
Floods occur as a result of various factors. Climate change is one of the dominant factors attributed to the increasing rainfall amounts, melting of glaciers and sea level rise. The changing rainfall pattern is causing places that are previously not exposed to floods to now experience extreme floods. Thus, the amount of rainfall is beyond the infiltrating capacity of the soil, which subsequently leads to floods in the area where there is no proper land use planning and drainage.
In addition, human activities such as the industrial and domestic emission of fossil fuels and flames into the atmosphere also contribute to the melting of glaciers, which is now evident through rising sea levels. Hence one of the reasons why there are major catastrophic floods in states that are bordered by the oceans.
What is the purpose of mapping communities prone to floods? Is it simply to help give early warning about possible flood incidents or is there an additional value, considering there are agencies in Nigeria that predict annual flooding?
The creation of digital papers, also known as Cartography, gives the possibility to understand where -location, communities, settlements - and what - population, farmland, market and schools - might be affected by a future flood occurrence. Our approach moves beyond the existing traditional method of conducting flood awareness campaigns informing major community members that there will be an increasing or heavy rainfall. [We let] them know the variation in their level of susceptibility to flooding and have a clear understanding of the number of the populace and other environmental features that might be affected when the flood occurs.
What happens after you map out areas that may be affected by flooding in a particular community? Do you just pass on the information to emergency agencies and community leaders or are there other things you do to ensure prompt action?
Aside from sending flood susceptibility maps to emergency institutions, we also share these maps on various social media platforms such as Facebook, Twitter and LinkedIn. [Social] media plays a powerful role in disaster risk reduction and emergency management through its quick and faster early warning communication and risk reduction advocates. Therefore, we adopt those platforms.
We also collaborate with other initiatives that work at the grassroots level and with volunteers who use our maps in the sensitisation and campaign in those locations we had mapped.
Tell us about the mapping process and how the GIS software works.
We use a GIS software which gives us the capabilities to augment Spaced-based sourced data, such as digital elevations, land use and soil data. Other datasets that enhance our analysis are the yearly Rainfall Prediction Dataset provided by the Nigerian Meteorological Agency, Administrative boundary files provided by the Office of Surveyor-General, River Network Information and many more. All are computed together to measure the extent and level of flood susceptibility in different selected study areas.
Furthermore, we developed a flood reporting web application, which is currently available for people to report flooding in real-time. [The flood reporting web application can be accessed here].
How do you systematically document and analyse results before sharing them? And what format are the results delivered in?
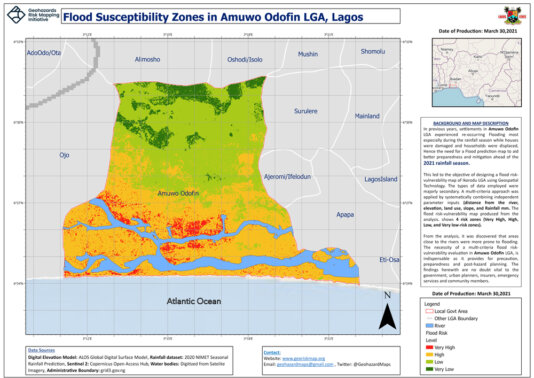
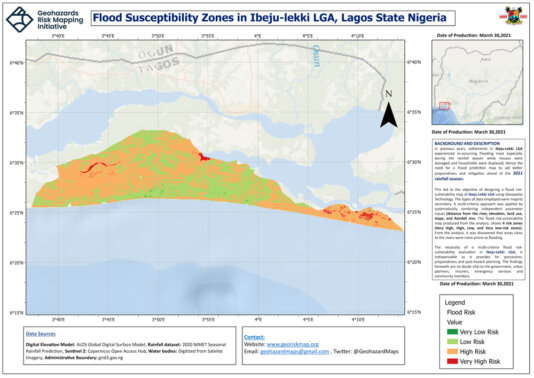
Our results are available in the form of cartographic maps (paper) which anyone can easily interpret. Additionally, we developed an excel file that lists out the names, coordinates information and the level of flood susceptibility for various markets, schools, communities and farmlands.
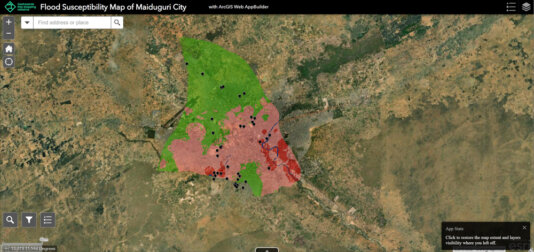
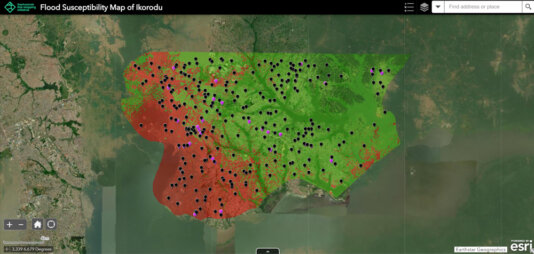
We also developed an interactive web map that can be accessed online - anyone can interact with this web map to search for their house address and confirm their level of susceptibility to floods.
How many communities have you mapped so far and what level of success have you recorded?
We have mapped 25 communities. These include Lagos State (Ikorodu, Ibeju, Lekki), Borno State (Maiduguri, Monguno) and communities in Benue, Kogi State and Adamawa State.
Our flood maps in the Maiduguri local government area exposed various internally displaced camps, which are made of vulnerable women and children who are already displaced as a result of the past year’s conflict, that are susceptible to flood in the coming rainfall season.
Do you receive any form of support from the government? How about from local and international bodies?
As of today, there is no funding support from any international body or government.
When communities are mapped and you share the results with relevant agencies such as the National Emergency Management Agency, do these agencies respond accordingly?
Yes, the agency receives the information and uses it to support its flood preparedness strategies and planning.
What response is expected of these relevant agencies when they get the results?
It depends on the agencies in question, but the Ministry of Environment, Ministry of Agriculture, Ministry of Education and National and State Emergency have so many roles to play in reducing the future impact of floods.
What practical measures would you suggest to help in preventing flood incidents in Nigeria?
Firstly, strict regulation and policy to curb waste disposal at various drainage channels and culverts should be implemented.
Secondly, there is a need for afforestation and programs that support tree planting. Research has shown that the presence of mangroves and wetlands is utilised to reduce the occurrence of floods.
Furthermore, Nigeria needs to fasten the energy transition from the use of fossil fuels to renewables to reduce the emission of greenhouse gases that changes the climate, which contributes to floods.
Finally, a precise and accurate map showing the communities and local government areas’ level of susceptibility to flooding should be provided to the people prior to the onset of rainfall. Such a provision will make citizens aware of the risk and allow them to enhance their preparedness for flooding, which will subsequently reduce flood impact if it eventually occurs.
Image by Immanuel Afolabi
By copying the embed code below, you agree to adhere to our republishing guidelines.

